

Conversion Rate: Formula, Examples, and Optimization
Conversion rate shows the percentage of a defined group that completed an action, such as a purchase or qualified lead. The formula is simple; the reporting context determines what the result means.
Conversion rate is conversions divided by the relevant population, then multiplied by 100. The action might be a purchase, a qualified lead, or another event marked as important. The population might be ad interactions, website sessions, or users, so two reports can produce different rates for the same week.
Use conversion rate inside conversion rate optimization work, next to conversion tracking and cost per acquisition. Together, those measures show both how efficiently traffic converts and how much useful business it produces.
The formula
Conversion rate = (conversions / denominator) x 100| Piece | What you must name |
|---|---|
| Conversions | The event, plus whether you count one per person or every event |
| Denominator | Ad interactions, sessions, users, or another stated population |
| Window | The same start and end for numerator and denominator |
| Scope | Campaign, landing page, device, or the full site |
Google Ads defines conversion rate as the average number of conversions per ad interaction, shown as a percentage: conversions divided by the ad interactions that can be tracked to a conversion in the same period. Its example is 50 conversions from 1,000 interactions, which is 5%.
GA4 no longer labels the same reports as “conversion rate.” After you mark an event as a key event, Google Analytics reports:
- Session key event rate: sessions in which a key event happened / total sessions
- User key event rate: users who performed a key event / total users
Those definitions are in Google’s Analytics dimensions and metrics table.
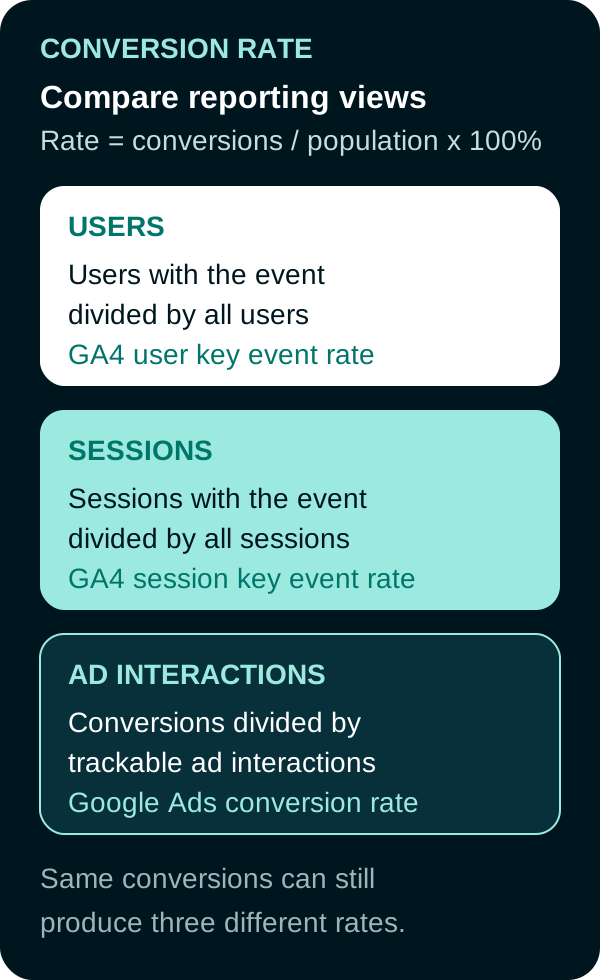
The same conversions can produce different rates when the report uses users, sessions, or ad interactions.
User, session, and ad-interaction rates
| Rate | Numerator | Denominator | What it answers |
|---|---|---|---|
| Google Ads conversion rate | Conversions, using the action’s count setting | Ad interactions that can be tracked to a conversion | Did paid clicks (or other billed interactions) produce the recorded action? |
| Session key event rate | Sessions with at least one key event | Sessions | Did visits complete the action at least once? |
| User key event rate | Users who triggered a key event at least once | Users | Did unique users complete the action at least once in the window? |
| Impression to conversion | Conversions | Impressions | Did exposure, not a click or a session, define the opportunity? |
A user can have several sessions. A session can have several purchases. An ad click can be followed by more than one conversion action. Mixing those layers without saying so is how a 5% “conversion rate” becomes an argument instead of a measurement.
Click-through rate still sits upstream: it tells you whether people chose the ad. Conversion rate tells you what happened after that choice, on the denominator you picked.
Count conventions and multiple conversions
Google Ads counting options are Every and One per conversion action:
- Every counts each conversion after the interaction. Google presents this as the usual choice for sales, because each sale can add value.
- One counts one conversion per ad click for that action. Google presents this as the usual choice for unique leads.
If you track more than one conversion action, or you count Every, Google Ads conversion rate can exceed 100%, because more than one conversion can be assigned to one interaction.
GA4 key event count follows the event’s counting method: Once per event counts every trigger, while Once per session counts the key event once in a session. Session key event rate is still the share of sessions with at least one key event, and user key event rate is the share of users with at least one. A buyer who purchases twice in the window still counts as one converting user for the user key event rate.
Worked numerical example
Hypothetical 30-day online store example:
- Google Ads clicks that can be tracked to a conversion: 1,000
- Purchase conversions in Google Ads, count set to Every: 80
- GA4 users: 3,200
- GA4 sessions: 4,000
- Users with a purchase key event: 70
- Sessions with a purchase key event: 75
- Purchase events: 80
| Report | Calculation | Result |
|---|---|---|
| Google Ads conversion rate | 80 / 1,000 | 8.0% |
| Session key event rate | 75 / 4,000 | 1.9% |
| User key event rate | 70 / 3,200 | 2.2% |
| Purchase events per session | 80 / 4,000 | 0.020 (not a GA4 key event rate) |
None of these is wrong. They answer different questions. The Ads figure is post-click on paid interactions. The GA4 session figure is visit-based across all traffic in the property. The user figure treats a repeat buyer as one converting user.
Now change the paid traffic mix. Clicks fall to 400, purchases fall to 48, and Google Ads conversion rate rises to 12%. The rate improved while order volume fell. Whether the new mix is better depends on spend, revenue, margin, and the value of those orders; conversion rate alone cannot answer that question.
Unbounce’s 2024 Conversion Benchmark Report, accessed September 20, 2026, states a 6.6% median conversion rate across industries on Unbounce landing pages. The same page says the data counts conversion events, not value per conversion. Use it as dated, method-scoped context, not a target for your site.
How to diagnose a rate change
Write the decision first: pause a campaign, change the page, or leave it alone. Then check whether the rate moved because of the numerator, the denominator, or the tracking.
Segment the rate, do not only read the account total.
| Split | Why it matters |
|---|---|
| Campaign, ad group, keyword, or ad | Mix shifts can raise the blended rate while a profitable segment shrinks |
| Landing page | One URL can hide a form error on another |
| Device | A mobile drop can be load time or a truncated form, not “the offer” |
| New versus returning | Returning users can inflate a user key event rate in a short window |
| Paid versus organic versus email | Google Ads conversion rate will not match a sitewide GA4 rate |
Check tracking before you rewrite the page.
- Confirm the event still fires once per real success. Pair this with the conversion tracking receipt steps.
- Confirm the Google Ads count setting is still One or Every as intended.
- Confirm the GA4 key event is the same action you are reading in Ads.
- Confirm consent, tag status, and duplicate firing. A broken tag can drop the numerator. A double fire can inflate it.
Read volume and value next to the rate. Keep conversions, spend, conversion value, margin, and qualified leads in the same table so a rate change stays connected to the business result.
Landing pages still matter, but only after the measurement is stable. Message match, load time, mobile layout, and a clear next step can change the numerator. Pair that work with landing page experience. Form length is a testable hypothesis, not a law.
Practical experiment guidance
Do not treat an ordinary before-and-after as a randomized test. Seasonality, auction pressure, and traffic mix can move conversion rate without a page change.
- Predefine the primary outcome: qualified conversions or conversion value, not conversion rate alone.
- Hold the offer, tracking, and (as far as the tool allows) the traffic source.
- Change one page or ad variable.
- Use the platform experiment or A/B tool when it can split comparable traffic. See A/B testing.
- If you cannot randomize, say so. A sequential test is still useful as a diagnostic, with those confounders listed.
- Read the result after the planned window. Do not stop on the first green day.
A remarketing list can raise conversion rate by sending warmer people. That is a mix change. Measure it as a mix change, not as proof that the landing page got better.
Conversion rate becomes useful when the action and reporting population are clear and the result is read beside volume, cost, and value.

Frequently Asked Questions
What is conversion rate?
Conversion rate is conversions divided by a relevant population, multiplied by 100. Depending on the report, that population might be ad interactions, sessions, or users. Compare rates only when the action, population, counting method, and date range match.
How do Google Ads and GA4 calculate conversion rate?
Google Ads conversion rate is conversions divided by ad interactions that can be tracked to a conversion. GA4 reports session key event rate as sessions with a key event divided by sessions, and user key event rate as users who triggered a key event divided by users. Those three rates can disagree on the same site.
Can conversion rate exceed 100 percent?
Yes, when the numerator can count more than one conversion per denominator unit. Google Ads notes that tracking more than one conversion action, or counting Every conversion, can push conversion rate above 100 percent.
Does a higher conversion rate mean a better campaign?
Not always. A higher rate can accompany fewer total conversions or less revenue. Read it next to spend, conversion volume, conversion value, margin, and cost per conversion.
Sources
- Google Ads Help, Conversion rate: Definition, accessed September 20, 2026.
- Google Ads Help, About conversion counting options, accessed September 20, 2026.
- Google Analytics Help, About key events, accessed September 20, 2026.
- Google Analytics Help, Change the counting method of key events, accessed September 20, 2026.
- Google Analytics Help, Analytics dimensions and metrics (session and user key event rate), accessed September 20, 2026.
- Unbounce, 2024 Conversion Benchmark Report, accessed September 20, 2026.
PUT THIS KNOWLEDGE TO WORK
NEED MORE HELP?
Talk with our team about applying Conversion Rate to your marketing.
Get a free marketing audit call