

Gross Rating Point (GRP): Formula and Worked Example
Gross rating points equal reach percentage multiplied by average frequency. A schedule reaching 40% of an audience three times delivers 120 GRPs.

Gross rating point (GRP) measures the total weight of a media schedule against a defined audience. The common formula is reach percentage multiplied by average frequency. A plan that reaches 40% of its audience an average of 3 times delivers 120 GRPs.
GRP combines two inputs into one planning number. The GRP total by itself does not tell you how many unique people were reached, how evenly impressions were distributed, whether the audience was on target, or whether advertising caused sales.
GRP formula and worked example
GRP = reach (%) × average frequency
Assume a television schedule reaches 400,000 people in a defined population of 1,000,000. Those reached receive an average of 3 exposures.
- Reach = 400,000 ÷ 1,000,000 × 100 = 40%
- Average frequency = 3
- GRP = 40 × 3 = 120
The schedule delivers 120 gross rating points. GRP can exceed 100 because it counts repeated exposure, not a percentage of unique people.
Why equal GRPs can describe different media plans
Three schedules can deliver the same total GRP while producing very different reach and repetition:
| Plan | Reach | Average frequency | GRP | Planning implication |
|---|---|---|---|---|
| Broad coverage | 60% | 2 | 120 | More unique reach, lighter repetition |
| Balanced example | 40% | 3 | 120 | Middle ground in this illustration |
| Concentrated repetition | 20% | 6 | 120 | Smaller audience, heavier repetition |
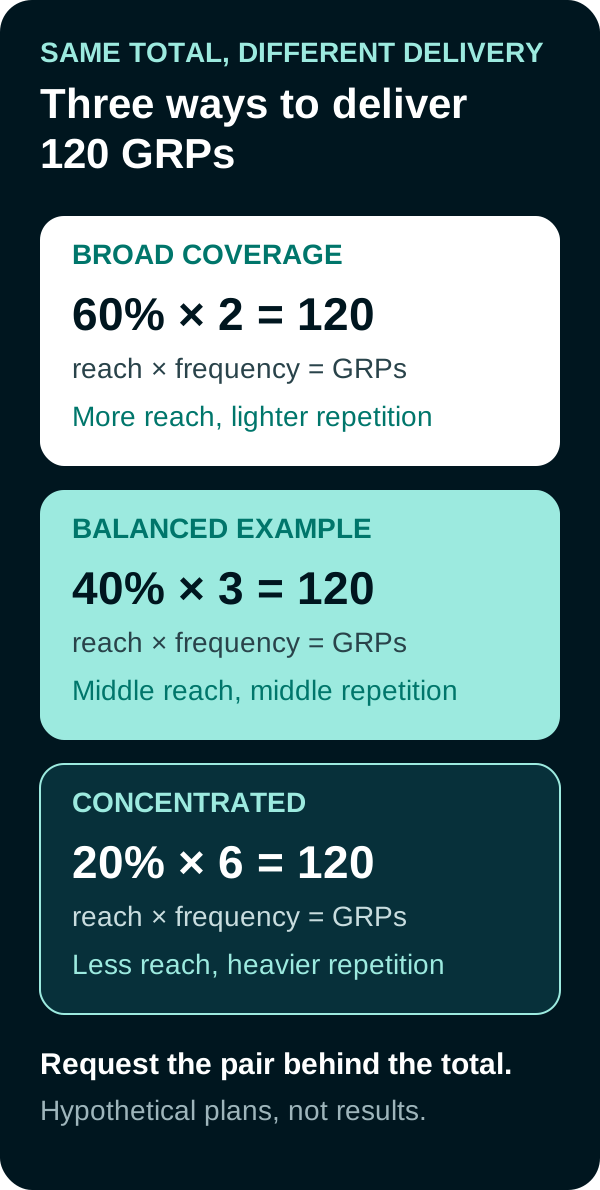
The arithmetic is identical. The audience experience is not. A planner should request the reach and frequency pair rather than judge a proposal by the GRP total alone.
What GRP tells you and what it leaves out
GRP is useful for comparing planned or delivered media weight when the audience base, geography, time period, and measurement method are consistent.
| GRP can help with | GRP cannot answer by itself |
|---|---|
| Comparing schedule weight | How many people were reached without duplication |
| Checking planned versus delivered weight | Whether frequency was evenly distributed |
| Summarizing reach and frequency | Whether the creative was noticed or remembered |
| Comparing periods with consistent definitions | Whether the campaign caused revenue or lift |
Nielsen’s audience measurement glossary defines gross rating points as the sum of rating points in a broadcast schedule and also expresses the relationship as reach multiplied by frequency. Nielsen’s TV measurement overview notes that frequency can remain difficult to control across platforms even when a plan is expressed in GRPs.
For a separate measure of awareness or consideration, review Google Brand Lift and its study requirements.
GRP versus reach, impressions, and TRP
- Reach is the unduplicated number or percentage of the defined population exposed at least once.
- Frequency is the average number of exposures among the people or households reached.
- Impressions count total ad deliveries. Dividing impressions by the size of the audience universe and multiplying by 100 can also express gross rating points when the inputs use compatible definitions.
- Target rating points (TRPs) apply rating-point logic to a specific target segment rather than a broader population. Usage varies, so confirm the provider’s audience base.
A report that says “120 GRPs” is incomplete without the target population, geography, dates, source, and whether the figure is planned or delivered.
How to compare GRP across linear TV and CTV
Linear television has long used ratings and GRPs as planning currency. Connected TV often reports impressions, household reach, frequency, and video completion instead. A cross-platform plan may translate delivery into a common framework, but simple addition can double count people reached on more than one channel.
For a useful comparison:
- Define one target population and geography.
- Label each source and its identity method.
- Keep planned and delivered figures separate.
- Show unduplicated reach only when the measurement method can support it.
- Report frequency distributions or ranges when available, not only an average.
- Keep attributed outcomes separate from incremental lift.
Read the connected TV guide for the delivery differences and CTV attribution for the limits of connecting exposure to a sale. Anderson Collaborative’s paid media capabilities cover planning across television and digital channels.

FAQs
What is a gross rating point?
A gross rating point measures the total weight of a media schedule against a defined population. GRP can be calculated as reach percentage multiplied by average frequency.
How do you calculate GRP?
Multiply the percentage of the target population reached at least once by the average number of exposures among people reached. A plan with 40% reach and 3 average exposures delivers 120 GRPs.
Can two media plans have the same GRP but different reach?
Yes. A 40% reach and 3 frequency plan, a 60% reach and 2 frequency plan, and a 20% reach and 6 frequency plan each equal 120 GRPs but create different audience experiences.
What is the difference between GRP and TRP?
GRP commonly describes schedule weight against a broad defined population, while target rating points apply the same logic to a specific target segment. Always confirm the audience base and provider definition before comparing plans.
Sources
- Nielsen, Audience Measurement Glossary, accessed September 19, 2026.
- Nielsen, How TV audiences are measured, published December 11, 2023, accessed September 19, 2026.
- Nielsen, Integrated Measurement Solutions, 2009.
PUT THIS KNOWLEDGE TO WORK
NEED MORE HELP?
Talk with our team about applying Gross Rating Point (GRP) to your marketing.
Get a free marketing audit call