

Market Penetration: Rate, Share, and Growth Plans
Market penetration is growth of an existing offer inside a market you already serve. The rate is current customers divided by that served market, not a substitute for market share.

Market penetration is growth of an existing offer inside a market you already serve. The useful number is the penetration rate: current customers divided by the served-market population, then multiplied by 100. Market share uses category sales, while market development takes the same offer into a market you do not yet serve.
Use it next to demand generation when the constraint is demand, and audience segmentation when the served market is too blunt. Paid media is a later step, after you know whether you need new buyers, more usage, or better access.
Rate, share, and market development
Penetration rate = (current customers / served-market population) x 100
Market share = (company sales / total category sales) x 100| Measure | Numerator | Denominator | What it answers |
|---|---|---|---|
| Penetration rate | Current customers in the window | People or accounts that can buy the offer | How much of the reachable buyer set already buys from you |
| Market share | Your sales (revenue or units) | Total category sales in the same market and window | How much of the money or volume you capture |
| Market development | Same offer | A market you do not yet serve | Whether growth requires a new geography, channel, or buyer type |
Igor Ansoff’s 1957 product-market matrix, reproduced with permission from his Harvard Business Review essay Strategies for Diversification, places market penetration in the existing-product, existing-market cell. Market development uses an existing product in a new market. Product development and diversification occupy the other two cells. Use those labels for the growth choice and the formulas above for the math.
A brand with fewer customers can still hold more share if those customers spend more. A brand with many light buyers can show a high penetration rate and a modest share. Name the unit and denominator whenever you compare the two metrics.
Define the served market
Write four inclusions before you count anything:
- Geography: the area you can actually fulfill.
- Buyer type: the person or account that can purchase (homeowner, office manager, licensed clinic).
- Offer: the product or service in scope, not adjacent categories you do not sell.
- Channel reality: where they can buy or book you today.
Exclude people you cannot serve because of license, delivery radius, language, credit, or product fit. The leftover count is the served market. It is smaller than a total addressable headline, and it should be rebuildable by someone else from the same rules.
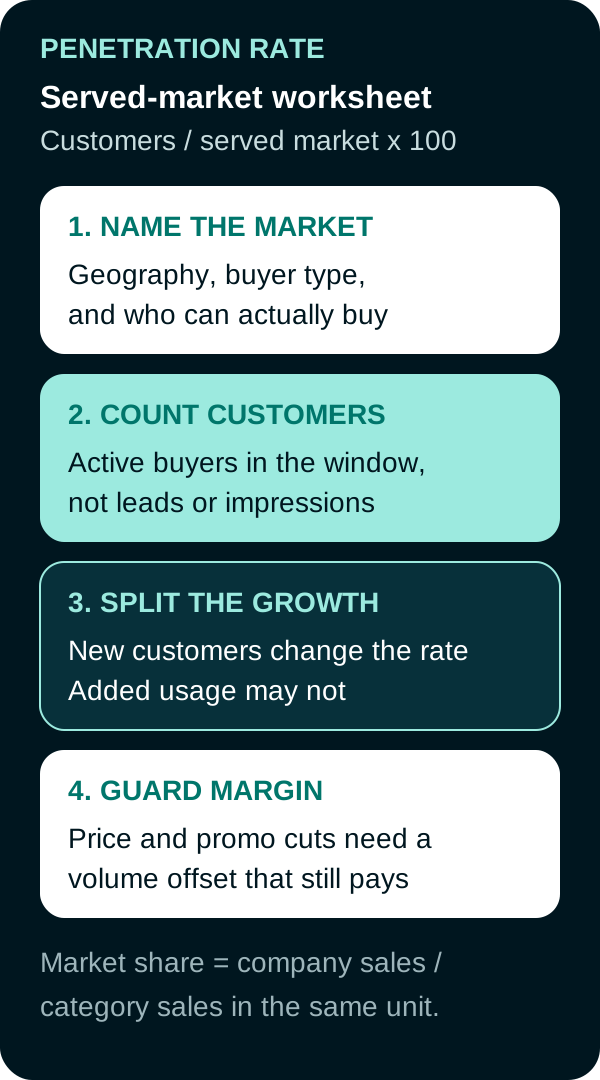
Penetration rate uses customer counts. Share uses sales. Promo math still needs a margin check.
Worked served-market example
Hypothetical regional HVAC installer over one calendar year:
| Input | Value |
|---|---|
| Geography | Three counties the firm can service in two days |
| Eligible buyers | Owner-occupied homes with central HVAC: 40,000 |
| Current customers (active service or install in the year) | 4,800 |
| Company category revenue | $7.2 million |
| Estimated category sales in the same area | $48 million |
- Penetration rate = 4,800 / 40,000 = 12.0%
- Market share = 7.2 / 48 = 15.0%
Revenue share is higher than eligible-household penetration: 15% versus 12%. That comparison alone does not establish average customer spend because the 40,000-household denominator includes nonbuyers. To explain the gap, separate actual category buyers, purchase frequency, and average job value.
New-customer versus added-usage split
| Move | Customers | Penetration | What share can do |
|---|---|---|---|
| Starting point | 4,800 | 12.0% | 15.0% |
| Add 600 new customers, same spend mix | 5,400 | 13.5% | Share rises if they buy |
| No new customers; current 4,800 spend 8% more | 4,800 | 12.0% | Share can still rise |
New logos change the rate. Heavier usage by current customers does not. If the dashboard only shows revenue, you cannot tell which happened.
Constraint diagnosis and margin guardrail
Name the constraint before you pick a lever.
| Constraint | Evidence | What extra promotion cannot fix |
|---|---|---|
| Demand | Low awareness, weak consideration, competitor preference | A market where people cannot buy, book, or receive the offer |
| Access | Missing retail, delivery, appointments, or payment options | Ads that send traffic into a closed door |
| Offer | Price or product fit fails against alternatives | Volume that arrives and then churns |
| Loyalty | Current customers under-use the offer | A plan that only talks to strangers |
Margin guardrail (same hypothetical). Average job price $2,000. Direct cost $1,300. Contribution $700 (35%). A 15% promotional cut makes price $1,700 and contribution $400. Contribution dollars stay even only if promoted volume is 700 / 400 = 1.75 times the unpromoted volume, before extra operating cost. Lower cost per job or higher rate does not automatically raise profit.
Price, distribution, and loyalty
| Approach | Best use | Main tradeoff |
|---|---|---|
| Price or offer change | Increase trial quickly | Margin pressure |
| Distribution expansion | Improve availability | Operational cost |
| Loyalty or usage growth | Deepen current demand | May miss new buyers |
Choose the row that matches the constraint. A trial discount is the wrong first move when customers cannot book. A loyalty program is the wrong first move when most category buyers have never heard of you. Demand-generation work builds desire. Access work opens the path to buy. They are not interchangeable.
When the worksheet is stable, paid media can recruit the missing buyers or remind current ones. Keep the served-market rules, the new-versus-usage split, and the margin check in the same file as the campaign.
Frequently Asked Questions
What is market penetration?
Market penetration is a growth strategy that seeks more sales of an existing offer inside a market the business already serves. The penetration rate is current customers divided by the served-market population, times 100.
How is penetration rate different from market share?
Penetration rate counts customers in a defined served market. Market share divides company sales by total category sales in the same market and window. A brand can have fewer customers and still hold more share if those customers spend more.
How do you define a served market?
Name the geography, the buyer who can actually purchase, and the offer they can buy through your real channels. Exclude people you cannot serve because of license, delivery, language, or product fit. Write the inclusions so someone else could rebuild the count.
Which growth lever should a team use first?
Diagnose the constraint first. Price or offer changes can raise trial and press margin. Distribution raises access and adds operating cost. Loyalty or usage growth deepens current demand and can miss new buyers.
Sources
- Ansoff, H. Igor, Strategies for Diversification, Harvard Business Review, September-October 1957. The linked Wiley excerpt above reproduces the original matrix with Harvard Business Review’s permission.
PUT THIS KNOWLEDGE TO WORK
NEED MORE HELP?
Talk with our team about applying Market Penetration to your marketing.
Get a free marketing audit call