

Engagement Rate: Formula, Calculator and 2026 Benchmarks
Engagement rate is interactions divided by reach, impressions, or followers, then multiplied by 100. Use the calculator and compare 2025 platform medians.
What is engagement rate?
Engagement rate expresses selected interactions relative to reach, impressions, or followers. A common formula is (total engagements / reach) × 100. Swap reach for impressions or followers when the question changes. Engagements normally mean likes, comments, shares, saves, and clicks.
Count the actions that matter to your goal, and keep the definition consistent across every post in the comparison. One person can take several actions, so an engagement rate is not automatically a percentage of unique people and can exceed 100% in some formulas.
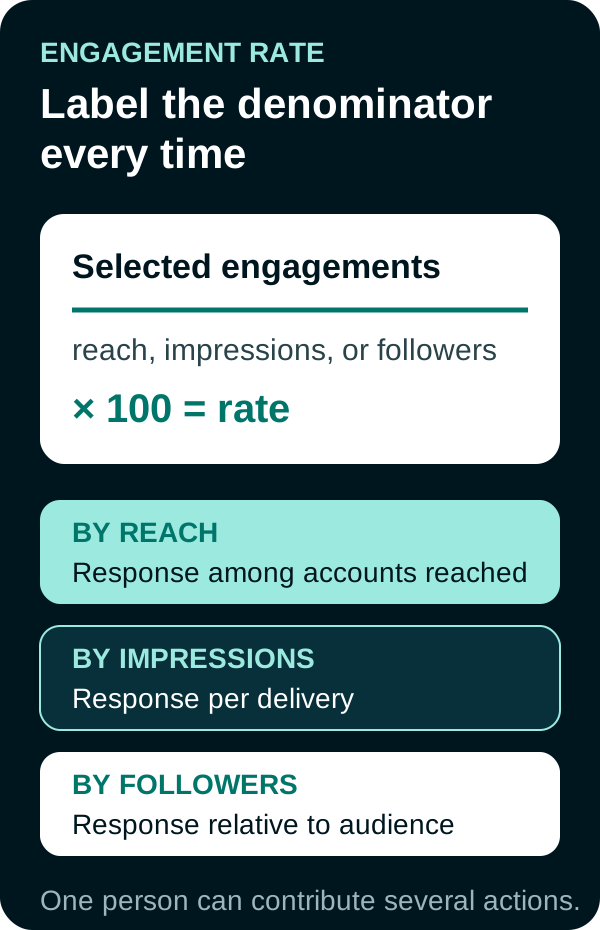
An engagement rate describes response relative to a selected audience or delivery count. It does not show whether those interactions produced qualified traffic, leads, revenue, or incremental lift.
Engagement rate calculator
Enter the interactions and the matching reach, impressions, or follower count. The calculator divides engagements by the denominator and multiplies the result by 100.
How to calculate engagement rate
Work through four steps.
- Total the engagements. Add likes, comments, shares, saves, and clicks for the post.
- Pick the denominator. Use reach, impressions, or followers, depending on the question you are answering.
- Divide, then multiply by 100.
- Label the result with the denominator you used.
Worked example: an Instagram post earns 310 likes, 42 comments, 88 shares, and 60 saves, for 500 total engagements. It reached 11,500 accounts.
(500 / 11,500) × 100 = 4.35% engagement rate by reach
The same post, measured against a 25,000-follower account:
(500 / 25,000) × 100 = 2% engagement rate by followers
Both numbers are correct. They answer different questions, so report the denominator next to the percentage every time.
How should benchmarks be used?
Platform formulas count different actions. Buffer’s 2026 engagement study analyzed more than 52 million posts across its studies, and its cross-platform baselines use 2025 data. It used engagements divided by reach where available. Its medians describe accounts included in Buffer’s dataset, not universal targets. Use them as dated reference points after comparing the post with your own platform, format, audience size, and historical median.
| Platform | Actions counted | Formula and worked example | 2025 median in Buffer’s study |
|---|---|---|---|
| Likes, comments, and shares; saves where available | 540 engagements / 10,000 reach × 100 = 5.4% | About 5.4% | |
| Reactions, comments, and shares | 560 engagements / 10,000 reach × 100 = 5.6% | About 5.6% | |
| Total engagements reported by LinkedIn | 610 engagements / 10,000 reach × 100 = 6.1% | About 6.1% | |
| TikTok | Engagements reported by TikTok | 450 engagements / 10,000 reach × 100 = 4.5% | About 4.5% |
Reach, impressions, and followers answer different questions. Keep one denominator throughout a comparison. Our platform-specific engagement rate guide explains how to normalize exports from Instagram, Facebook, LinkedIn, and TikTok before comparing them.
Which engagement rate should you use?
| Formula | Best used for | Main limitation |
|---|---|---|
| By reach | Judging response among people who saw the post | Reach definitions vary by platform |
| By impressions | Evaluating paid delivery or repeated exposure | Repeat views can lower the rate |
| By followers | Comparing posts when reach is unavailable | Inactive followers can distort the result |
- Choose reach to judge how well content moved the people who encountered it.
- Choose impressions for paid campaigns or posts with frequent repeat views.
- Choose followers for a quick account-level comparison when reach data is unavailable.
Record the denominator beside every rate in reports. A label such as “2% by reach” prevents teams from comparing two percentages built from different inputs.
Engagement rate analysis checklist
- Set the objective. Choose awareness, conversation, traffic, leads, or another measurable outcome.
- Define engagement. Decide which actions count before exporting data.
- Choose one denominator. Use reach, impressions, or followers based on the objective.
- Build a baseline. Compare posts from the same platform, format, audience, and time period.
- Segment the results. Review topic, creative format, hook, call to action, and posting time.
- Find repeatable patterns. Look for traits shared by posts above your historical median.
- Test one change. Change one variable, publish enough posts for a useful comparison, and record the result.
An analytics dashboard can keep the formula, denominator, and reporting window consistent. Teams that need channel-level measurement can also review our reporting and analysis capabilities.
How to improve engagement rate
- Write the opening line for one clear audience need.
- Match the format to the message instead of forcing every idea into the same template.
- Ask for a specific action, such as answering a question or saving a checklist.
- Respond to comments when a response adds useful information.
- Rework strong organic posts into structured paid social tests.
- Compare each test with the baseline and keep the changes that improve the target action.

What does current research add?
Sprout Social’s 2026 statistics summary says 68% of teams focus primarily on engagement when tracking social media return. That finding explains why engagement receives attention, but it does not make engagement a financial return metric. Buffer’s cross-platform baselines use 2025 data through December 3, 2025. Both sources are dated context rather than a substitute for an account’s own baseline.
How Anderson Collaborative reads engagement rate
Our view: Engagement rate is useful only when the denominator and counted actions remain visible. We compare like formats within one platform, then inspect which interactions signal attention, conversation, or intent before changing the content plan.
Frequently Asked Questions
What is engagement rate on social media?
Engagement rate expresses selected interactions relative to reach, impressions, or followers. Because one person can take several actions, it is not necessarily the percentage of unique people who engaged.
How do you calculate engagement rate?
Divide total engagements by the denominator that matches your goal, then multiply by 100. Use reach to measure people exposed, impressions to measure total views, or followers to compare a post with the account audience.
What is a good engagement rate?
A useful benchmark comes from the same platform, content format, audience size, and reporting period. Compare current results with your own historical median before using broad industry averages.
How can you improve engagement rate?
Review results by topic and format, identify posts that beat your baseline, and test one variable at a time. Strong tests may change the hook, creative format, call to action, posting time, or audience.
Video by Influencity, published October 3, 2023.
Sources
PUT THIS KNOWLEDGE TO WORK
NEED MORE HELP?
Talk with our team about applying Engagement Rate to your marketing.
Get a free marketing audit call